Batteries are indeed, a waste of money. This means to say that if the power grid was 100% reliable, batteries would not be necessary!
The many worldwide power outages over the past several years make batteries essential as a backup source. Who actually gives batteries a second thought? We simply expect them to work when called upon. Experience has shown that this expectation is pure fiction.
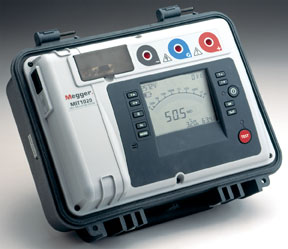
 Megger 246002B – Megger 246002B Battery Impedance Tester The instrument measures internal cell impedance and DC terminal voltage
Batteries are extremely important to provide electricity to support many assets and revenue streams during outages. For example, in a generating station, if the turbine suffers an outage, without the back-up battery the turbine lube oil priming pumps would not continuously keep the bearings lubricated causing major damage and lengthy outages. In hospitals, who wants to be in the middle of an operation when an AC outage occurs without proper battery back-up? The applications for batteries are innumerable and frequently unseen. In this world of dependency upon electricity, it is impossible to survive without battery back-up.
Battery Basics
So what makes a battery tick? All batteries, whether rechargeable (secondary) or disposable (primary), use chemical reactions to make electricity. It is necessary to have two dissimilar metallic materials in a current-carrying medium. In lead-acid batteries, the two dissimilar metallic materials are lead and lead oxide in a sulphuric acid medium. Nickel Cadmium batteries use nickel and cadmium compounds in a potassium hydroxide electrolyte medium. Nickel metal hydride batteries (NiMH) are comprised of the same nickel compound as in NiCd cells but the cadmium compound is replaced with a metallic hydride and the liquid electrolyte is replaced with a paste to carry the current. The two types of nickel cells are virtually identical in performance. Even their voltages are the same! Lithium batteries use a lithium-containing oxide or phosphate and carbon. For the purposes of stationary battery testing, this article focuses mainly on lead-acid batteries.
 Megger BITE 3 – The Megger BITE3 Battery Impedance Test Equipment determines the health of lead-acid cells up to 2000 Ah
With the importance of batteries established let us consider their chemistry and ways of assessing their health. The age-old habit of testing only the voltage and specific gravity doesn’t work – it never has and never will. The reason for this is that the sum of all of the cells’ voltages must equal the charger output. Voltage (and specific gravity) of lead- acid batteries basically follows the sulphate. If a battery is fully charged, the sulphate will be in the acid and its voltage and specific gravity will be normal (with few exceptions.) If it is in a discharged state, the voltage will be low and since there is at least some sulphate on the plates, the specific gravity will also be low. These tests will therefore reveal the state of charge of the battery, but not its state of health. If the battery has a normal voltage, there is no indication of the health of the battery. When the voltage is abnormal, it may be an indication of a potential problem, but may also be that the battery is merely to some extent discharged.
Nickel cadmium batteries behave somewhat differently than lead-acid batteries. In lead-acid batteries the acid is actually part of the electrochemical process; it reacts with the lead and lead oxide to make electricity. The KOH electrolyte in NiCd batteries is simply a carrier for the current and does not enter the chemical reaction. Therefore, measuring specific gravity of NiCd batteries in service doesn’t indicate anything about the condition of the battery. The one exception is carbonation of the electrolyte. This is caused, over time, by the absorption of carbon dioxide from the air into the KOH and reduces the specific gravity of the electrolyte. If this happens, check with the battery manufacturer. It may simply be a matter of replacing the electrolyte.
Battery Tests
The range of possible tests on a battery ranges from doing nothing (not a good idea) to doing every test possible (still not a good idea). The possible tests include voltage, specific gravity, float current, ripple current, cell temperature, ambient temperature, discharge current and time, intercell connection resistance, capacity (load test), impedance (an internal ohmic test), among others.
Float Voltage
Taking them one at a time, voltage can be one of those misleading tests. Voltage is important, absolutely, and if it is abnormal, then it indicates something about the condition of the battery. If it is normal, it indicates nothing at all about a battery’s condition. This is because voltage is more of an indicator that the charger is functioning properly. The sum of the voltages of all of the batteries in the bank must equal the charger output voltage, resistive losses excluded. A normal voltage is not an indicator of battery capacity, but an abnormal voltage needs further investigation.
Specific Gravity
Specific gravity is similar to voltage as an indicator of battery health. The sulphate is part of the electrochemical reaction. If the battery is discharged, some of the sulphate migrates to the plates and the acid is reduced in specific gravity. If the battery is fully charged, all of the sulphate is in the acid and the specific gravity is normal, say 1,215. There aren’t any studies to validate any correlation between specific gravity and battery capacity. In fact, IEEE 450 has de-emphasised specific gravity to the point of checking only 10% of the batteries each quarter and the full bank annually.
Float Current
In order to keep a battery charged, there is a battle of sorts going on in the battery between its self-discharge and the charger. The battery is always in a state of self-discharge which creates a differential in potential between the battery bank and the charger. This differential in potential causes a small current to flow to keep the battery fully charged. This DC current is called float current.
In flooded lead-acid batteries there is no possibility of thermal runaway because the liquid acid cools the battery through the process of evaporative cooling. However, VRLA batteries do not have extra acid, nor is it in a free liquid form. If the float current increases due to some impending failure or overcharging condition, the temperature increases . The increased temperature allows for more current to flow and further increases the temperature of the battery. A runaway chemical reaction ensues, which can lead to the melting of the battery causing an open circuit. The time from when the float current starts to increase and when thermal runaway might occur is between one and four months. Float current is an important parameter to measure in VRLA batteries.
Ripple Current
Ripple current is a product of the charger which converts AC into DC. No charger has a 100% ripple-free conversion process, which is why filters are frequently added in certain applications. Ripple current generally increases slowly over time as electronic components degrade. If, however, a diode in the rectifier blows, the ripple current can double. As with float current, an increase in ripple current to a point greater than about 5 amps rms for every 100Ah of battery capacity (5%), leads to increased temperature and shortened battery life. Ripple current is another parameter that should be measured periodically.
Temperature
Battery and ambient temperature, although they don’t dictate immediate doom for a battery, can lead to premature failure. For every increase of 10°C in battery temperature above 20°C, the battery life is halved. This means, for example, that a 20 year battery maintained at 35°C instead of the specified 25°C will only last about ten years. In Europe the standard temperature is 20°C and 15 year design life for flooded batteries.
Discharge Current and Time
Discharge current and time is now used more frequently in on-line monitors to aid in determining amp-hours removed and replaced. The value of measuring current and time and calculating Ah removed and replaced is that battery capacity can presumably be calculated. This author believes that there is value in this calculation. The caveat is discussed below under capacity (load) tests.
Intercell Connection Resistance
Intercell connection resistance is one of the tests that needs to be performed, especially if frequent outages occur. It has been said that more than 50% of battery bank failures are due to loose intercell connectors. This is a straightforward test to perform and it can be done in conjunction with impedance testing (discussed below) or as a stand-alone test using a low resistance ohmmeter. Intercell connections come loose due to heating and cooling cycles caused by discharging and recharging as a result of outages. The posts expand and contract and because lead is very malleable will cold flow with each cycle. This is one of the reasons that battery manufacturers tend to recommend tightening bolts to the low end of the torque range so as not to add further stress during cycling.
Capacity
Capacity tests are a necessary evil. If performed properly, they are expensive, time-consuming and have limited predictive value depending upon their frequency. Consider a battery bank that is designed to provide eight hours of back up time. A proper capacity test incorporates a second battery in case of a power outage during the discharge test. This second battery must be at least the same size or bigger than the main battery being tested. The resistive load bank must be connected to the main battery bank and voltage leads are connected to each battery in the bank. This usually takes a full day.
On day 2 the eight hour test begins. A test for intercell connection resistance is often performed before the start of the capacity test. There are two schools of thought about performing the intercell connection resistance test:
1) It is not representative of a true “as found” autonomy test.
2) Certain precautions need to be taken to ensure that no major malfunctions occur that could have been avoided.
If there are major malfunctions, then the bank or at least some of the batteries will need to be replaced in an emergency situation. This decision is for those at each company who write procedures and maintain batteries.
Day 3 is the continuation of the recharge of the main bank. The voltage leads are removed and the resistive load bank is disconnected. The main battery recharge may continue on day 4 if the battery is not yet fully charged and ready for service. A properly run capacity test is the only true method of determining the bank’s actual capacity.
Impedance and Resistance
Impedance, an internal ohmic test, indicates the capability of a cell to deliver current. It is correlated to capacity. Although correlation to capacity is not 100%, it is an excellent way of finding weak batteries in the bank. The EPRI study reveals how well impedance and other internal ohmic tests work in finding weak cells. The impedance test applies and measures an AC current signal and measures simultaneously the AC voltage drop across a battery caused by the AC current signal. Following Ohm’s law, Z = E/i, impedance is calculated. Impedance is inversely proportional to capacity in that as capacity decreases, impedance increases. This test is fast (about 30 minutes for a 60-cell substation battery bank) and is non-invasive.
Data Analysis
What is done with the data collected? How is the data interpreted to ensure that the battery bank will meet the required duty cycle? With the advent of better testing methods such as impedance, more useful data (rather than only voltage and specific gravity) can now be obtained. With such data come the data-handling problems and the analysis to paralysis problems. The recommended method is to use a database to track and trend all battery data over time and dispense with paper forms that cannot compare today’s data with yesterdays. A specialized database, one with space for all measured parameters, is important to aid in determining the condition of batteries and banks.
Entering limits, with which the user is comfortable, in order to gain the most life from a battery without increasing risk, aids tremendously in extracting the most from a battery. The limits should be set for each parameter measured. For example, float voltage limits should follow manufacturers’ guidelines. Internal ohmic test limits are more debatable. In some cases, users will set a “failure limit” of 50% impedance increase for VRLA batteries from a predetermined baseline value. Float current limits tend to be less precise depending upon the size, age and alloy of the battery.
Conclusion
There are many failure modes for batteries. With care and measurement these can be dramatically reduced, especially if little to no testing is presently being performed. The battery is installed, not to add to work load, but to support critical electrical equipment or revenue streams. Proper testing and data analysis can help determine when a battery should be replaced. Testing also helps reduce emergency battery replacements and assists in budgetary planning, thus reducing cost. A properly implemented battery testing regime does not necessarily reduce the work load but it will, most likely, increase reliability of the entire DC network. (Marius Pitzer, Megger)

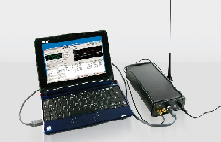
 The 40 Watt model (the AV-108E-5A-B) is entirely self- contained in a single chassis, and is powered from a standard AC line connection (100-240 Volts, 50-60 Hz). Available to the USA Only

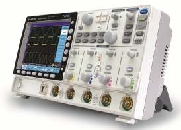


 Yorktown Heights, NY – 10 Jun 2011: Today, IBM Research scientists announced that they have achieved a milestone in creating a building block for the future of wireless devices. In a paper published yesterday in the magazine Science, IBM researchers announced the first integrated circuit fabricated from wafer-size graphene, and demonstrated a broadband frequency mixer operating at frequencies up to 10 gigahertz (10 billion cycles/second).


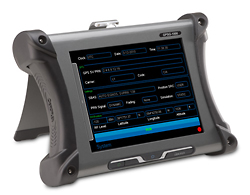
 The satellite constellation comprises satellites in low earth orbit that provide the ranging signals and navigation data messages to the user equipment. The ground control network tracks and maintains the satellite constellation by monitoring satellite health and signal integrity and maintaining the satellite orbital configuration. Furthermore, the ground control network also updates the satellite clock corrections and ephemerides as well as numerous other parameters essential to determining user position, velocity and time (PVT). The user equipment receives signals from the satellite constellation and computes user PVT. More details on each of the aforementioned GPS segments are provided below.